Call for contributions
Go to top
We are inviting contributions in the form of scientific papers and video demonstrations (see descriptions below) in all domains related to immersive analytics. We are particularly interested in work combining AI and VR/AR, but sole AI or VR/AR work is fine, too, as long as it shows potential for the future integration of both research fields. Concrete topics of interest include, but are not limited to:
- IA systems, system design, implementation, toolkits
- IA applications, use cases, case studies, experiences
- Innovative VR/AR usage for IA (ideally with potential for including AI techniques)
- Innovative AI usage for IA (ideally with potential for integration into VR/AR systems)
- IA interaction, authoring and creation of IA systems, collaboration
- Human factors, multimodality, social aspects, evaluations
- Theoretical frameworks, models, position statements, surveys
Because the goal of the workshop is also to identify promising areas for future research and usage of AI, prototypes, work-in-progress, position and research statements, and work that offers only preliminary results but clearly shows potential is welcome as well. Contributions can be made in one of the following two ways:
-
Paper submissions:
Papers illustrate technical or scientific contributions (including position statements) that will be presented at the workshop via a talk or poster presentation.
Authors should submit a PDF of their paper that is formatted according to the IEEE Manuscript Formatting guidelines.
Page limit is 6 pages (including references). Paper submissions can be non-anonymous.
Authors are encouraged to submit accompanying videos with their papers, but this is not required.
- Demo/video submissions: Demo/video contributions illustrate innovative ideas, use cases, full as well as prototyped systems that demonstrate all kinds of work related to the topics of interest of this workshop. They will be presented at the workshop via video recordings and discussions with the authors. Authors should submit a PDF of an accompanying paper that is formatted according to the IEEE Manuscript Formatting guidelines. Page limit for the accompanying paper is 2 pages (including references). Demo submissions can be non-anonymous. Authors are required to upload a first version of the video that will be shown at the workshop to demonstrate their work.
Accepted papers and accompanying demo papers will both be included into the conference proceedings and published in the IEEE Xplore Digital Library. Please follow the IEEE policies for publications (i.e., you must own copyright to all parts and the manuscript must be original work and not currently under review elsewhere).
Electronic Submission System: Please submit your paper to the ImAna workshop via EasyChair (Select the "Workshop: Immersive Analytics" track for your submission)
Important dates & deadlines
Go to top
- Submission deadline (papers & demos/videos):
September 24October 4, 2020 (AoE) - Notifications: October 16, 2020
- Workshop: Dec 14-18 at IEEE AIVR (concrete day TBD)
Programme
Go to top
Workshops are intergrated into the main IEEE AIVR conference and are included in each conference registration.
Session 1 (120 minutes)
- 13:30-13:40: Welcome & intro
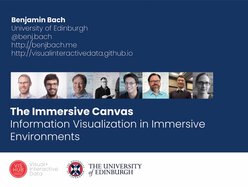
- 13:40-14:30: Keynote speech & Q&A - Benjamin Bach
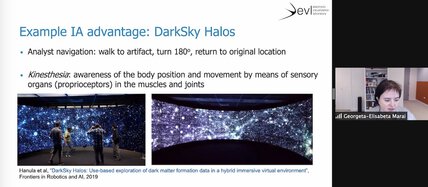
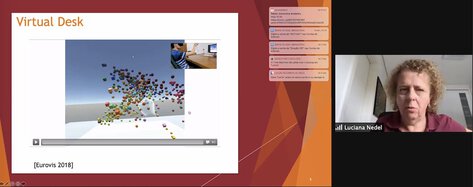
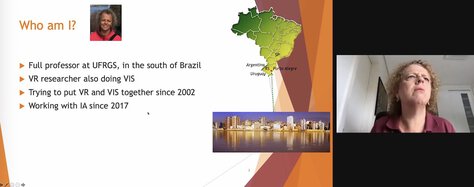
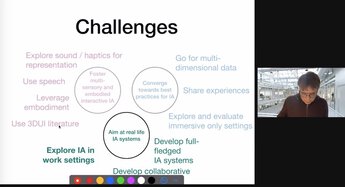
- 14:30-15:30: Panel with invited speakers - Benjamin Bach, Liz Marai, Luciana Nedel, Yannick Prie
Session 2 (80 minutes)
- 17:30-18:00: Presentation of papers
- Immersive Visualization of Dengue Vector Breeding Sites Extracted from Street View Images
- Mirrorlabs - creating accessible Digital Twins of robotic production environment with Mixed Reality
- 18:00-18:05: Demo introduction
- 18:05-18:35: Parallel demo session/activities
- Virtual Reality Lifelog Explorer: A Prototype for Immersive Lifelog Analytics
- DatAR: An Immersive Literature Exploration Environment for Neuroscientists
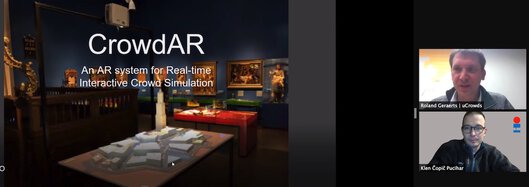
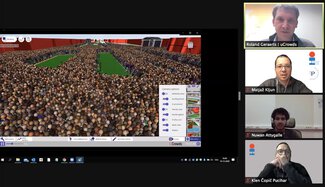
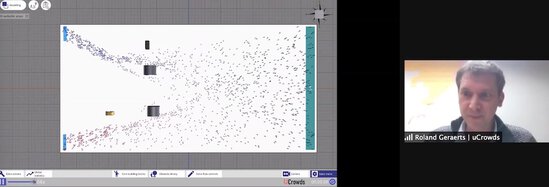
- CrowdAR Table - An AR system for Real-time Interactive Crowd Simulation
- Exploring Visualisations for Financial Statements in Virtual Reality
- 18:35-18:50: Closing session, discussion, get together
Keynote - Benjamin Bach
Go to top
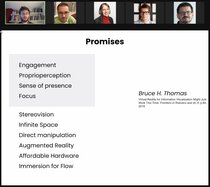
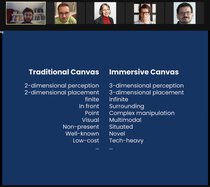
The Immersive Canvas: Data Visualization and Interaction for Immersive Analytics
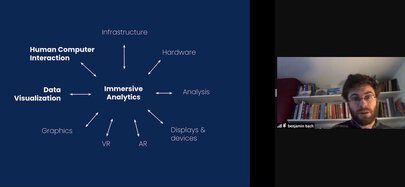
This talk explores the role of interactive data visualization for immersive analytics. Immersive analytics is becoming a complex field that combines many fields of expertise: analytics, big data, infrastructure, virtual and augmented systems, image recognition and many others, as well as human-computer interaction and visualization. In order to make sense of complex data, we need visualization interfaces: in immersive environments, data visualization is freed of the limitedness of the traditional desktop screen; able to expand into an infinite canvas and the third dimension. What potential does this bring for data visualization and immersive visualization? How can we leverage this potential? How is this changing our approach to visualizing and interacting with data?
 About the presenter: Benjamin is a Lecturer in Design Informatics and Visualization at the University of Edinburgh. His research designs and investigates interactive information visualisation interfaces to help people explore, communicate, and understand data. Before joining the University of Edinburgh in 2017, Benjamin worked as a postdoc at Harvard University (Visual Computing Group), Monash University, as well as the Microsoft-Research Inria Joint Centre. Benjamin was a visiting researcher at the University of Washington and Microsoft Research in 2015. He obtained his PhD in 2014 from the Université Paris Sud where he worked at the Aviz Group at Inria. The PhD thesis entitled Connections, Changes, and Cubes: Unfolding Dynamic Networks for Visual Exploration got awarded an honorable mention as the Best Thesis by the IEEE Visualization Committee.
Panel on IA
Go to top
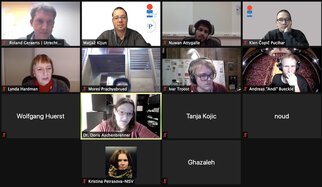
As a part of the workshop we are organising a panel on IA with invited speakers. The panel will be moderated by Lynda Hardman. Our panelists are all renowed scientists and will provide their view on the opportunities, challenges and future of the filed. The panelists are:
Papers, presentations, videos & links
Go to top
Papers
- Immersive Visualization of Dengue Vector Breeding Sites Extracted from Street View Images
Mores Prachyabrued, Peter Haddawy, Krittayoch Tengputtipong, Myat Su Yin, Dominique Bicout and Yongjua Laosiritaworn
Abstract | Presentation | Video | Paper on IEEE Xplore (comming soon) | Project page
Not added.
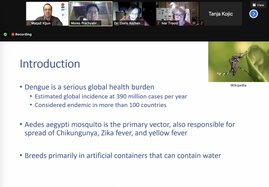
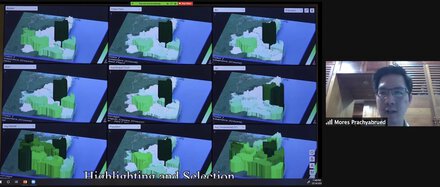
Dengue is considered one of the most serious global health burdens. The primary vector of dengue is the Aedes aegypti mosquito, which has adapted to human habitats and breeds primarily in artificial containers that can contain water. Control of dengue relies on effective mosquito vector control, for which detection and mapping of potential breeding sites is essential. The two traditional approaches to this have been to use satellite images, which do not provide sufficient resolution to detect a large proportion of the breeding sites, and manual counting, which is too labor intensive to be used on a routine basis over large areas. Our recent work has addressed this problem by applying convolutional neural nets to detect outdoor containers representing potential breeding sites in Google street view images. The challenge is now not a paucity of data, but rather transforming the large volumes of data produced into meaningful information. In this paper, we present the design of an immersive visualization using a tiled-display wall that supports an early but crucial stage of dengue investigation, by enabling researchers to interactively explore and discover patterns in the datasets, which can help in forming hypotheses that can drive quantitative analyses. The tool is also useful in uncovering patterns that may be too sparse to be discovered by correlational analyses and in identifying outliers that may justify further study. We demonstrate the usefulness of our approach with two usage scenarios that lead to insights into the relationship between dengue incidence and container counts.
- Mirrorlabs - creating accessible Digital Twins of robotic production environment with Mixed Reality
Doris Aschenbrenner, Jonas Rieder, Danielle van Tol, Joris van Dam, Zoltan Rusak, Jan Blech, Mohammad Azangoo, Salu Panu, Karl Kruusamäe, Houman Masnavi, Igor Rybalskii, Alvo Aabloo, Marcelo Petry, Gustavo Teixeira, Bastian Thiede, Paolo Pedrazzoli, Andrea Ferrario, Michele Foletti, Matteo Confaloneiri, Daniele Bertaggia, Thodoris Togias and Sotiris Makris
Abstract | Presentation | Video | Paper on IEEE Xplore (comming soon) | Project page
How to visualize recorded production data in Virtual Reality? How to use state of the art Augmented Reality displays that can show robot data? This paper introduces an open- source ICT framework approach for combining Unity-based Mixed Reality applications with robotic production equipment using ROS Industrial. The goal of this project is to facilitate setup and scientific exchange within the area of Mixed Reality enabled human robot co-production. The focus of this publication is the use case for data analysis.
Demos
- Virtual Reality Lifelog Explorer: A Prototype for Immersive Lifelog Analytics
Aaron Duane, Björn Thór Jónsson and Cathal Gurrin
Abstract | Presentation | Video | Paper on IEEE Xplore (comming soon) | Project page
The Virtual Reality Lifelog Explorer is a prototype for immersive personal data analytics, intended as an exploratory effort to produce more sophisticated virtual or augmented reality analysis prototypes in the future. An earlier version of this prototype competed in, and won, the first Lifelog Search Challenge (LSC) held at ACM ICMR in 2018.
- DatAR: An Immersive Literature Exploration Environment for Neuroscientists
Ivar Troost, Ghazaleh Tanhaei, Lynda Hardman and Wolfgang Hürst
Abstract | Presentation | Video | Paper on IEEE Xplore (comming soon) | Project page
Not added.
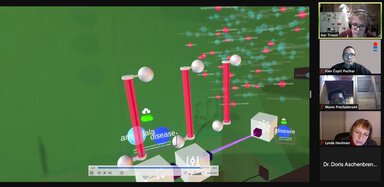
Maintaining an overview of publications in the neuroscientific field is challenging, especially with an eye to finding relations at scale; for example, between brain regions and diseases. This is true for well-studied as well as nascent relationships. To support neuroscientists in this challenge, we developed an Immersive Analytics (IA) prototype for the analysis of relationships in large collections of scientific papers. In our video demonstration we showcase the system's design and capabilities using a walkthrough and mock user scenario. This companion paper relates our prototype to previous IA work and offers implementation details.
- CrowdAR Table - An AR system for Real-time Interactive Crowd Simulation
Noud Savenije, Roland Geraerts and Wolfgang Hürst
Abstract | Presentation | Video | Paper on IEEE Xplore (comming soon) | Project page
Not added.
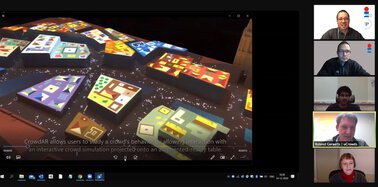
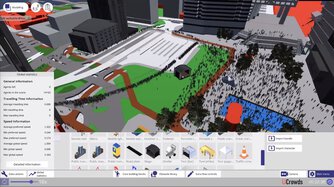
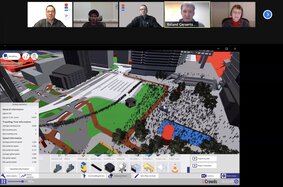
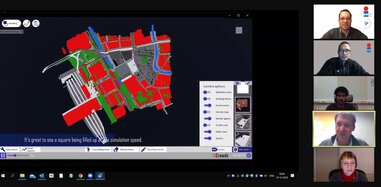
Spatial augmented reality, where virtual information is projected into a user's real environment, provides tremendous opportunities for immersive analytics. In this demonstration, we focus on real-time interactive crowd simulation, that is, the illustration of how crowds move under certain circumstances. Our augmented reality system, called CrowdAR, allows users to study a crowd's motion behavior by projecting the output of our simulation software onto an augmented reality table and objects on this table. Our prototype system is currently being revised and extended to serve as a museum exhibit. Using real-time interaction, it can teach scientific principles about simulations and illustrate how such they, in combination with augmented reality, can be used for crowd behavior analysis.
- Exploring Visualisation for Financial Statements in Virtual Reality
Tanja Kojic, Sandra Ashipala, Sebastian Möller, Jan-Niklas Voigt-Antons
Abstract | Presentation | Video | Paper on IEEE Xplore (comming soon) | Project page
Not added.
Not added.
Recent developments in Virtual Reality (VR) provide vast opportunities for data visualization. Individuals must be motivated to understand the data presented concerning their personal ifnancial statements, as with better understanding comes more eiffcient money management and a healthier future-minded focus on planning for their personal ifnances. This paper aims to investigate how a 3D in VR visualization scenario inlfuences an immersed usersʼ capability to understand and engage with personal ifnancial statement data in comparison to a scenario where a user would be interacting with 2D personal ifnancial statement data on paper. This was achieved by creating a 2D paper prototype data and utilizing the beneifts of 3D in a VR prototype visualization. Both prototypes consisted of chart representations of personal ifnancial statement data, which were tested in a user study. Also, participants (N=23) were given a set of tasks (such as "Find the quarter in which the least amount of expenses was spent") to solve by using 2D or 3D ifnancial statements. Results show that participants reported interaction is statistically signiifcant more natural with 2D data on paper than interactions with 3D data in VR. Also, participants reported that they perceived statistically signiifcant more considerable delay between outcome and their action with 3D data in VR. However, effectiveness, measured by the percentage of correctly solved tasks, in both versions enabled participants to answer almost all given tasks successfully. Those results are showing that VR as a medium could be used for analyzing ifnancial statements. In future developments, several additional directions could be incorporated. Exploring data visualization is essential not only for the ifnancial sector but also for other domains such as taxes or law reports.
Organisers & contact
Go to top
Gallery
Go to top


